Instruction counts
Preview — Ranvier is pre-release; its APIs and these figures may change.
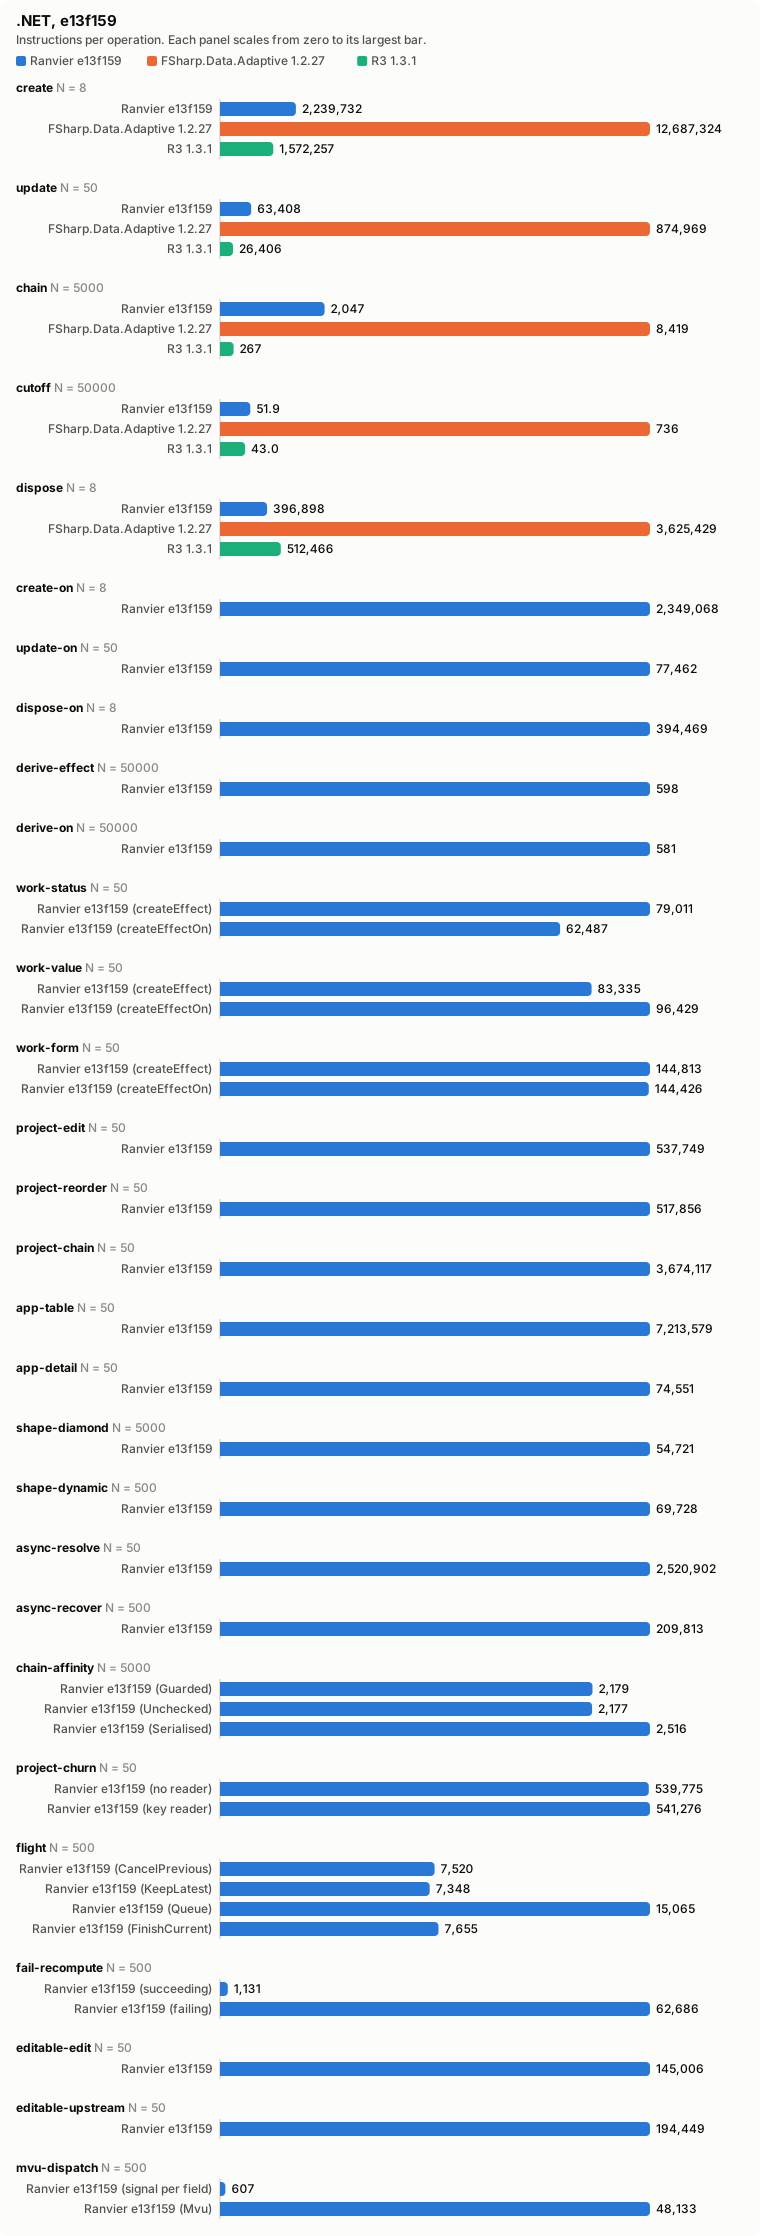
The counter bench measures whole scenarios rather than single primitives: creating and disposing rows, propagating writes, projections, application-shaped workloads, graph shapes and async boundaries. Each figure is retired processor instructions per operation, (m(2N) − m(N)) / N, read from hardware counters. Under matched, stable measurement conditions, differences below about 5 % are treated as run-to-run noise. Larger differences still need measurement-state checks. Under Node, the harness settles each case under full tiering and keeps tier-up disabled across its measured regions; a region in which V8 compiles is reported as compiled.
CI also runs every Node case under node --jitless (runtime node-jitless), with one warm-up run and no settling. The interpreter executes the same bytecode whichever objects earlier runs left alive, so these counts follow the work done, and they are the Node figures the perf gate checks. Tiered Node counts depend on V8's optimisation history and are reported without a gate.
The static .NET and Node charts below are the historical e13f159 run. The interactive views use recorded CI measurements (hardware counters and allocations on arm64, CPU time on x64) and identify the selected commit explicitly. The broader October 4 report at 878f294 includes timed operators and additional derived/effect scenarios. The later keyed-pass report is a targeted comparison for #56, rather than a replacement for every chart panel.
Each panel scales from zero to its largest bar, so bar lengths compare engines within a scenario, not scenarios with each other.
CI counter history
The chart compares the selected metric per operation across commits and includes engine comparisons where the run provides them. Choose a runtime, metric and scenario; .NET and Node.js remain separate because their measurements are not comparable. Select a commit point or label to inspect its library comparison; open its source using the commit link. Hover or focus marks for exact values, toggle libraries in the legend, and switch between absolute values and values relative to Ranvier. The site builds this history from the perf-data branch after each successful master measurement. Perf skips documentation-only commits and commits whose final message paragraph carries a Perf-Ignore: trailer, so the history holds measured commits only.
Loading recorded measurements…
Library comparison
Explore the scenarios together, filter by name, or choose a recorded commit. Each panel has its own scale from zero; compare library costs within a scenario. Toggle a library in the legend to isolate the others. Relative values use Ranvier at the selected commit as their reference.
Loading recorded measurements…
.NET
.NET 10.0.12, with tiered compilation, PGO and ReadyToRun off. Ranvier at e13f159, FSharp.Data.Adaptive 1.2.27, R3 1.3.1.
Fable under Node.js
Node.js v26.7.0 (--expose-gc --single-threaded), fable-library-js 5.18.0. Ranvier at e13f159, Fable.Ripple 1.0.0-beta.5. Bars are main-thread figures.
The CI counter history runs Node.js 26 with --expose-gc --single-threaded --min-semi-space-size=32 --max-semi-space-size=32. The semi-space flags fix each V8 semi-space at 32 MB, and every measured region starts with the same young-generation capacity.
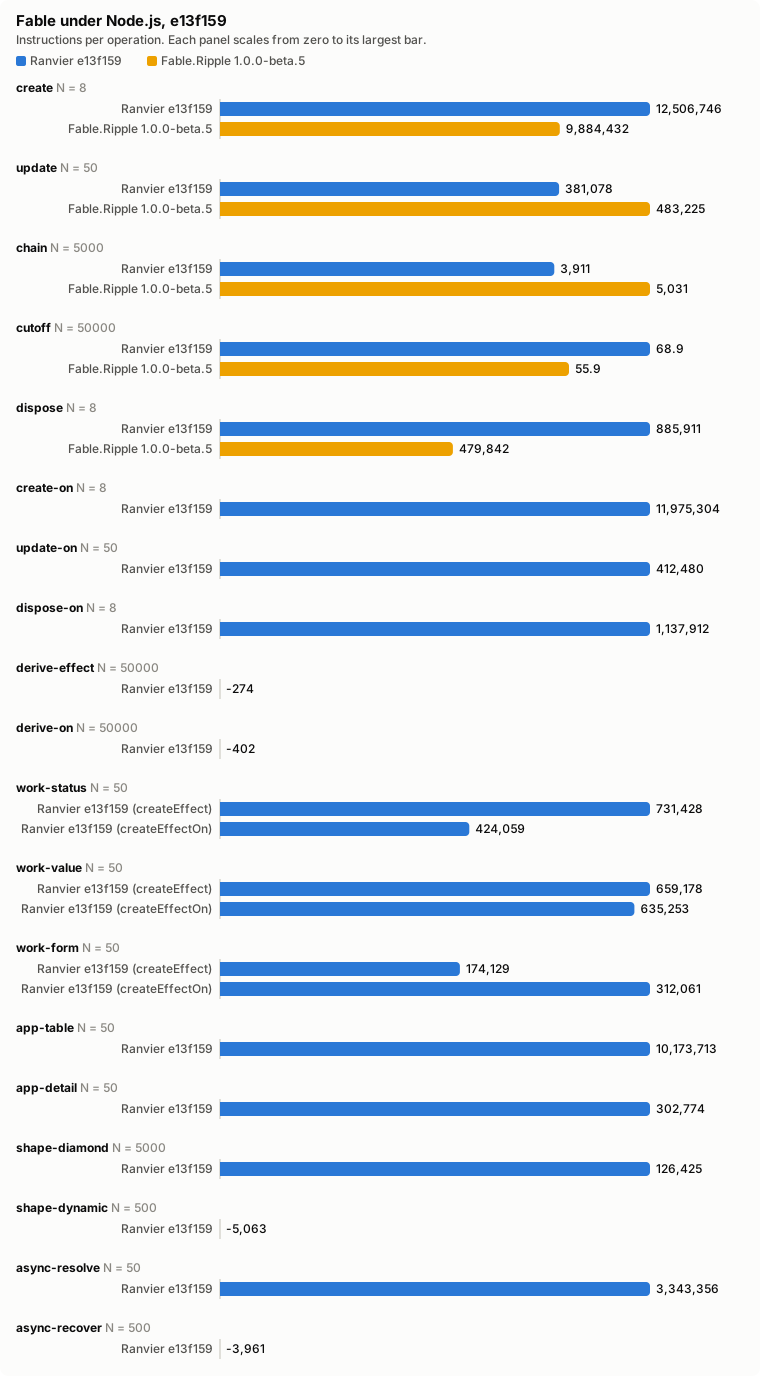
Scenarios with a negative figure (derive-effect, derive-on, shape-dynamic, async-recover) show no bar. A negative subtraction is a measurement limitation, not negative engine work.
Fable core follow-up
#57, merged as 2ce4b7d, removes redundant Fable affinity/inbox work, observer/dependency slot wrappers, async continuation and lock callbacks, and checked scheduler queue stores. The .NET executable implementation is preserved.
The source investigation at d962b84 measured the combined patch before its core-only cherry-pick into master. Three fresh processes per version/scenario, forty warmups and twenty-one measured rounds gave median elapsed-time reductions of 36% for equal writes, 11% for updates, 26% for disposing 1,000 rows and 34% for creating 1,000 rows; the 2% chain difference was treated as noise. These are timings for that experiment, not fresh retired-instruction counts for #57. Creation/disposal remain sensitive to JIT state and warmup. Renderer changes and the measured playground bundle saving in that report were not merged by #57.
The companion historical-counter investigation compares d87920f, 878f294 and the PoC's 2ef3876 snapshot. Historical Node creation totals were nonlinear in N; separate traces of the isolated scenario found compilation/deoptimisation inside measured regions. Those traces demonstrate the protocol's vulnerability, not the exact compilation cost in the historical full-suite runs. The reported +18.5% creation delta therefore does not establish a steady-state source regression. The disposal gap remains an observation under that protocol, requiring a compilation-audited, scale-checked matched rerun before assigning it to a feature. No new hardware-counter acceptance run is claimed for #57.
Wave B scenarios
Seven scenarios measure Ranvier alone, on .NET only. A scenario with variants reports each variant as its own bar.
| Scenario | One operation | Variants |
|---|---|---|
chain-affinity | Write the source of a chain of 4 memos and read the tail. | Guarded, Unchecked, Serialised |
project-churn | Replace the last key of a 1000-row projection with a new key. | No key reader; one key reader read by an effect |
flight | Write an async memo's trigger and read it, twice, then settle every flight the writes started. | CancelPrevious, KeepLatest, Queue, FinishCurrent, Drop, DropWhilePending |
fail-recompute | Re-run a memo and its one reader, then read the reader's ErrorOrigin. | Succeeding; failing with a fresh exception |
editable-edit | Edit every 10th of 1000 editables, each read by one effect. | — |
editable-upstream | Write the seed source of every 10th of 1000 editables. | — |
mvu-dispatch | Change one field of a 64-field model with one reader per field. | A signal per field; Mvu.Dispatch with a Select per field |
The static .NET chart includes these scenarios at e13f159, which predates the Drop and DropWhilePending variants of flight; the CI charts include every variant. Bars are colored by engine, and a scenario's variants share their engine's color.
Later scenarios
These scenarios postdate e13f159 and appear only in the CI charts. Each measures Ranvier alone.
| Scenario | One operation | Variants | Runtimes |
|---|---|---|---|
keyed-remove, keyed-swap, keyed-insert | Alternately apply and undo one edit of a 1000-row projection: remove the middle row, swap the second and second-to-last rows, or prepend a row. | Fresh items; stable items; memo-free rows | .NET, Node.js |
stream-burst-1, stream-burst-16, stream-burst-256 | Deliver 1, 16 or 256 items per round into a stream fold read by a memo and an effect. | A stream, batched; an AsyncSource, batched and unbatched | .NET, Node.js |
stream-restart | Write a dependency of a stream, restarting it, then deliver one item; or of an async memo, restarting its flight. | A stream; an async memo under CancelPrevious | .NET, Node.js |
control | Refill a 256-entry closure table, sum it and sort a copy of its array. | — | .NET, Node.js |
control runs no Ranvier code. Every worker process measures it last, as a reference for the state of the process and the machine. When control moves on a runtime, the perf verdict reports that runtime's regressions as inconclusive.
Reading the charts
- Engines differ in semantics. R3 pushes each write straight to its subscribers, without batching or glitch-free ordering. FSharp.Data.Adaptive disposal removes callback subscriptions only.
- .NET and Node figures do not compare. The .NET worker runs with PGO off; V8 optimises adaptively.
The full report, with cycles, branch misses, allocations and library counters per scenario, is docs/.ai/benchmarks/counters/e13f159.md in the repository.